

Gumroad Sales Attribution: The Sankey Diagram Playbook
For StackContacts users who want to see where their money actually comes from

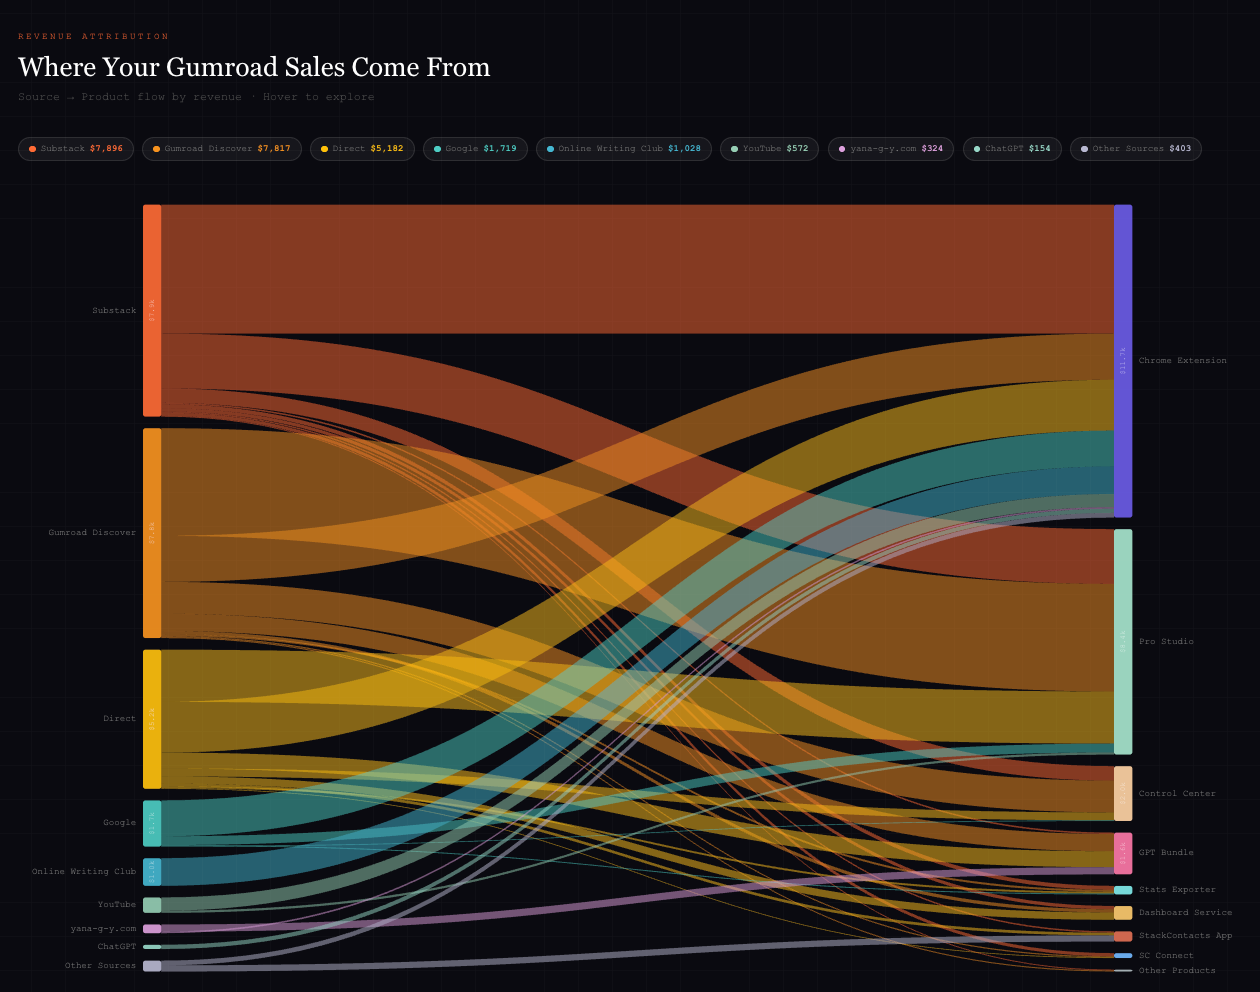
A Sankey diagram that maps traffic source → product → revenue — so you can see exactly which channels are driving which sales, not just total revenue by source.
Like a plumbing diagram for your business.
What you need:
StackContacts app connected to Claude (via MCP)
At least a few months of Gumroad sales synced
~15 minutes
Step 1: Pull Your Raw Attribution Data
Open Claude with StackContacts MCP enabled. Paste this prompt:
Using StackContacts, query my Gumroad sales data and show me revenue
by source and product. Use the gumroad_sales table in my schema
(pub_[yourpublication]_substack_com). Group and categorize the referrer
field into clean source names (Substack, Gumroad Discover, Direct, Google,
YouTube, etc.) and show total revenue per source/product combination.
What Claude will do: It’ll hit the gumroad_sales table, find the referrer field, and categorize the messy referrer URLs into clean source labels.
The SQL it runs looks like this (for reference):
SELECT
  product_name,
  CASE
    WHEN referrer IS NULL OR referrer = '' OR referrer = 'direct' THEN 'Direct'
    WHEN referrer ILIKE '%substack%' THEN 'Substack'
    WHEN referrer ILIKE '%gumroad%' THEN 'Gumroad Discover'
    WHEN referrer ILIKE '%google%' THEN 'Google'
    WHEN referrer ILIKE '%youtube%' THEN 'YouTube'
    WHEN referrer ILIKE '%twitter%' OR referrer ILIKE '%x.com%' THEN 'Twitter / X'
    WHEN referrer ILIKE '%linkedin%' THEN 'LinkedIn'
    ELSE 'Other: ' || regexp_extract(referrer, 'https?://([^/]+)', 1)
  END AS source,
  COUNT(*) AS num_sales,
  SUM(price) / 100.0 AS total_revenue
FROM pub_[yourpub]_substack_com.gumroad_sales
WHERE COALESCE(refunded, false) = false
GROUP BY product_name, source
ORDER BY total_revenue DESC
Note: If you publish under multiple Substack publications, Claude can union all three schemas and use one publication as the canonical dataset to avoid triple-counting sales that appear in multiple syncs. Ask it: “Use MyPublicationName as the canonical publication to avoid counting the same sale twice.”
Step 2: Build the Sankey Diagram
Once you have the data, give Claude this follow-up prompt:
Now build me an interactive Sankey diagram from this data.
Flow direction: Source (left) → Product (right).
Size each flow by revenue.
Make it dark-themed, with color-coded sources and hover tooltips
showing revenue and sale count. Build it as a React artifact.
Claude will generate a self-contained React JSX component using D3’s Sankey layout. The output renders inline in the Claude chat window — no setup required.
See the Note I shared below:
What the diagram shows:
Left column = traffic sources (Substack, Gumroad Discover, Direct, Google, etc.)
Right column = your products
Flow width = revenue volume
Hover any flow to see exact dollar amount and sale count
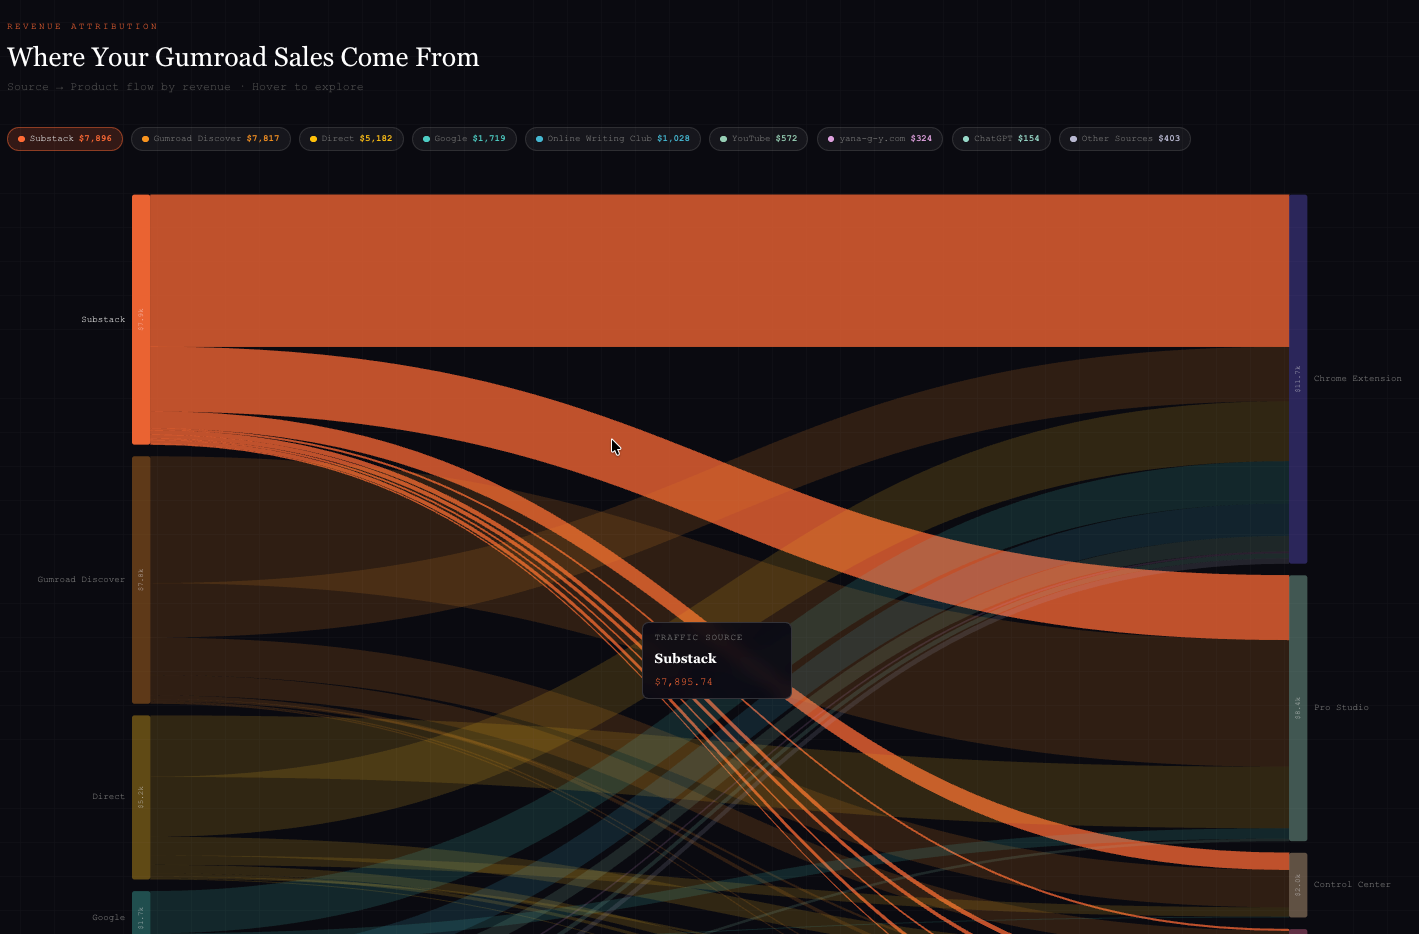
Step 3: Read the Diagram
A few things to look for once it renders:
Thick flows you didn’t expect — these are your hidden winners. A random referrer driving disproportionate revenue is worth investigating.
Thin flows from sources you’re actively working — if you’re posting on YouTube every week but the YouTube → Product flow is a hair, that’s signal.
Source concentration risk — if one source dominates and it’s Gumroad Discover (organic discovery), that revenue can vanish overnight if Gumroad’s algorithm changes. (It has.)
Product-source fit — some products convert well from search (evergreen content), others only from warm audiences (newsletters). The Sankey makes this visible instantly.
Step 4: Ask Follow-Up Questions
The diagram is the starting point. Here are the follow-up prompts worth running:
Which source has the highest average order value?Show me how Gumroad Discover revenue has trended month by month —
has it grown or declined?Which products have the most diversified source mix vs.
which are dependent on a single channel?Are there any referrer domains in the 'Other' bucket
that are generating meaningful revenue I should know about?Gotchas to Know
price is stored in cents. Always divide by 100.0 to get dollar values. Claude handles this automatically if you ask for revenue in dollars.
Refund filtering matters. Use COALESCE(refunded, false) = false — a plain refunded = false can miss NULL rows and undercount live sales.
“Direct” is a fuzzy bucket. A significant chunk of “Direct” traffic is actually newsletter clicks that lost their UTM parameters in transit. It’s not pure bookmarks/type-ins. If you have UTM parameters on your Substack links, those will surface separately; if not, treat Direct as “partially newsletter.”
Gumroad Discover vs. Substack are often nearly equal in revenue — and both are platforms you don’t own. That’s worth sitting with.
The One-Prompt Version
If you want to skip the explanation and just run it, paste this entire prompt into Claude with StackContacts MCP active:
Using StackContacts, query the gumroad_sales table in my Substack schema.
Categorize the referrer field into clean source names (Substack,
Gumroad Discover, Direct, Google, YouTube, and Other with domain extraction).
Filter out refunded sales using COALESCE(refunded, false) = false.
Convert price from cents to dollars. Group by source and product_name.
Then build an interactive dark-themed Sankey diagram as a React artifact
showing source → product flows sized by revenue, with hover tooltips
showing revenue and sale count.
That’s it. One prompt, one diagram.
About This Playbook
Built from a live analysis on Finntropy using StackContacts + Claude MCP. The original Sankey was posted on Substack Notes.
StackContacts syncs your Gumroad sales, Substack subscriber data, and Notes engagement into a queryable database — so you can ask questions like this without ever touching a spreadsheet.
— Finn
@stacksave